What to do with 10 million GPS points?
Posted: October 3rd, 2011 | Author: mikel | Filed under: mics, openstreetmap, swaziland, tech | Leave a comment »10876681 to be exact. Recording once per second over 4+ months, eight GPS units were taken over every road in Swaziland (background on this survey). If not for some mishaps with batteries and missing SD cards, etc, the count would likely be double that.
Under the project description, the guidance had a lot of freedom for working with the GPS data: “Develop simple software demo interface, incl. analytical tools and manual for monitoring fuel consumption in household surveys.”. (In other words, do cool stuff). After some experimentation, we decided to go with three demonstrations: animation of the traces, tiles for use in OpenStreetMap data collection, and fuel consumption estimate plugin in JOSM. All the code is up on GitHub.
Visualization has always been an inspirational tool for data collection and holistic comprehension, especially in OpenStreetMap. Tom’s animation of London GPS tracks in 2005 is still inspirational, and more recently, ITO’s visualization of edits following the Haiti quake. I’ve used party render many times to animate traces during a mapping party, like this one in Mumbai, and experimented with different styles, like at Yuri’s Night.
The challenge here was to make a visualization on such a large number of points. Split up the task into processing and loading the GPX files into a PostGIS database, and then producing frames of an animation from the db. Having the database would also allow production of other products, like tiles. This set of scripts processes directories full of GPX; change the paths depending on your layout.
Thought about experimenting with SpatiaLite or ElasticSearch too, but that will wait for another time. libcinder would be an amazing platform to try, once geo support is in place.
The animation scripts generate a series of images using Mapnik, time slices from the db, and then the frames are assembled using a series of ImageMagick compositions and effects, and then the frames are combined into a movie using ffmpeg.
The result pretty clearly show the progress of each survey team over the months, with Swaziland as a whole emerging by the end. If there had been more time, would have experimented with more dramatic effects, movement of the camera view, music.
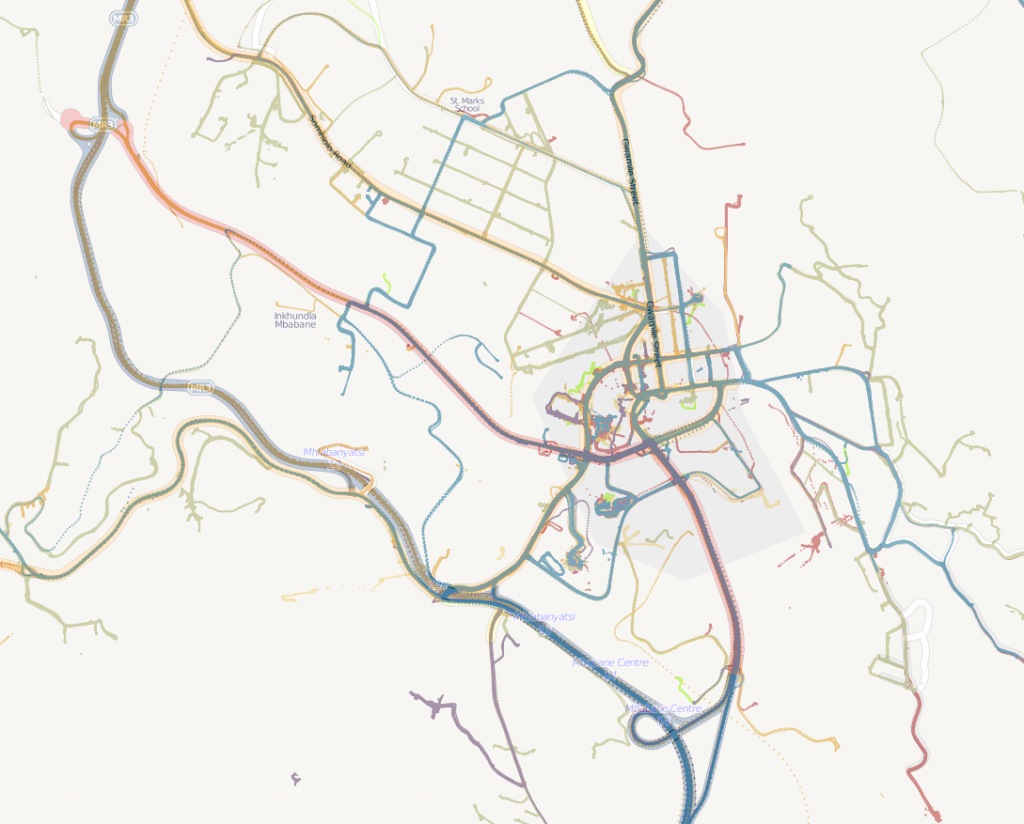
Tiles allow for careful exploration of this large data set. This map has shows all 10 million points rendered together. You can notice that a large number of the GPS traces cover new ground for OSM, so can be used as a tracing source for OSM. Typically in OSM, GPS traces are uploaded/downloaded for tracing, but with the high volume of points, it’s just not practical. The number of points over a particular segment of road gives some sense of its “importance” and “classification” (more used, more likely a major road).The tiles can be configured for use in tracing in Potlatch (http://rockburger.com/mics/tiles/!/!/!.png) and in JOSM (http://rockburger.com/mics/tiles/{zoom}/{x}/{y}.png).
Tiles were again generated using a modified Mapnik script. I experimented with the style and colors using TileMill, by converting a sample of the GPS data into a Shapefile (as of last week, TileMill now has PostGIS support), and converting the carto style sheet into a mapnik config file (carto can just be run on the command line). TileMill doesn’t yet have direct tile output, and I just needed a directory of tile files.
For the gas monitoring application, decided to build it into a JOSM plugin, as it will run on all platforms and should already be part of the MICS GPS toolkit. Started from the ElevationProfile plugin which already generates some stats on GPX files. The modifications add a calculation of fuel usage, based on city and highway fuel consumption rates. The compiled plugin can be downloaded, and then installed in the plugins directory of your JOSM profile; in the Plugins panel of JOSM, simply activate the plugin.
There are lots of ways this can be improved in future applications. ElevationProfile only works on a single GPX file, while this should be adjusted to work on groupings. Additional statistics would be interesting: distance per day, distance average by hour of day, distance average by day of week, distance speed minute by minute; and aligning those stats to points on the map would give some metrics for classification of OSM roads. GPX tracks should have some preprocessing, to simplify and filter out bad readings. Other software to experiment with is Viking an open source, cross platform personal GPS data management tool, and TopCube, which builds desktop apps on node.js apps.
In all this was a lot of fun, opened up some fresh programming avenues for me for dealing with large volume geodata, and should inform further development for MICS.


